2021 has been an unusual year and soil test results will be no exception. Drought conditions followed by the rain events we’ve been experiencing over the last week will add irregularities to our results. Here are 5 tips to keep in mind while reviewing your soil test results this fall.
1. Expect Above Average Levels Of Residual Nitrogen
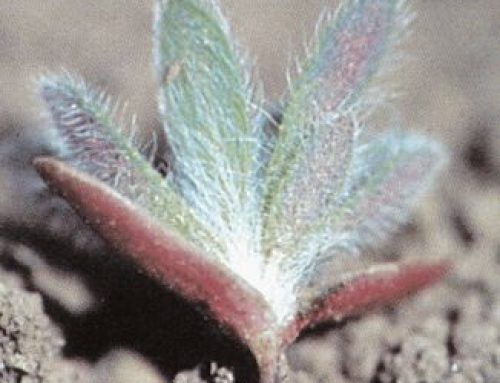
A lack of any appreciable snow accumulation and rainfall in many areas this past growing season has resulted in below average yields for many. It was quite evident that a lack of moisture was the major yield limiting factor this year. You could see every depression, ridge, and snowbank. Many fields were fertilized for higher yield potential. Couple this with a lack of significant rainfall that might cause leaching or denitrification and we could see significant levels carrying over this fall.
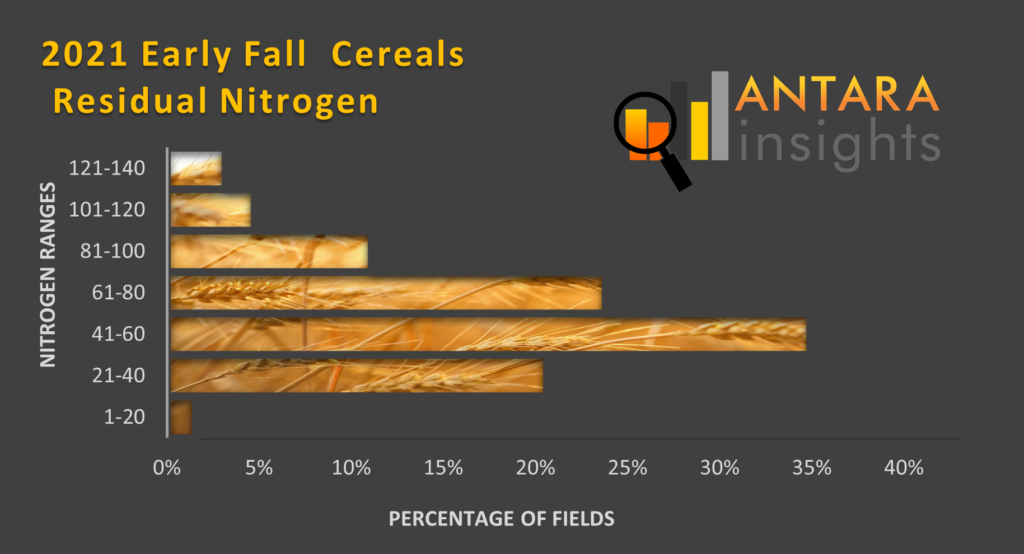
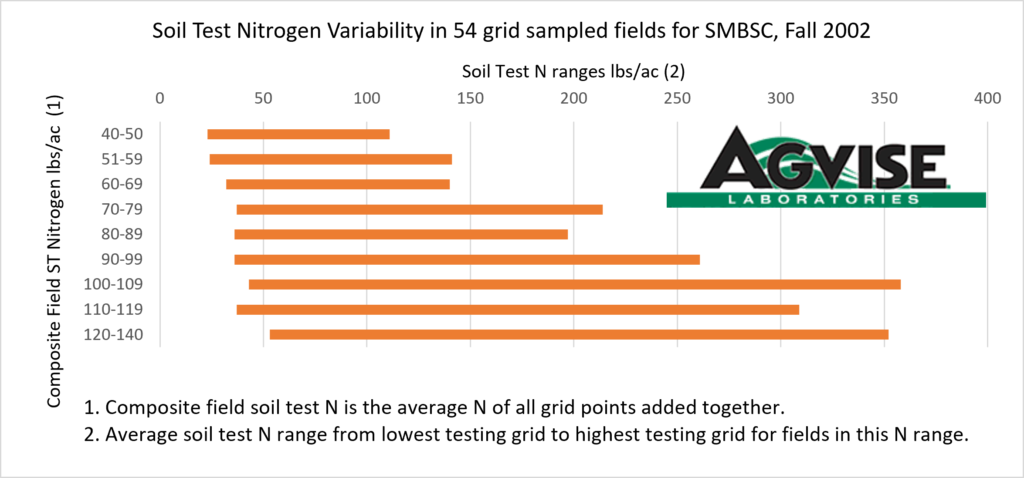
The above graph depicts the variability in residual nitrogen for field submitted to Agvise this fall. For more information click on the following link:
Understanding high residual soil nitrate-nitrogen following drought
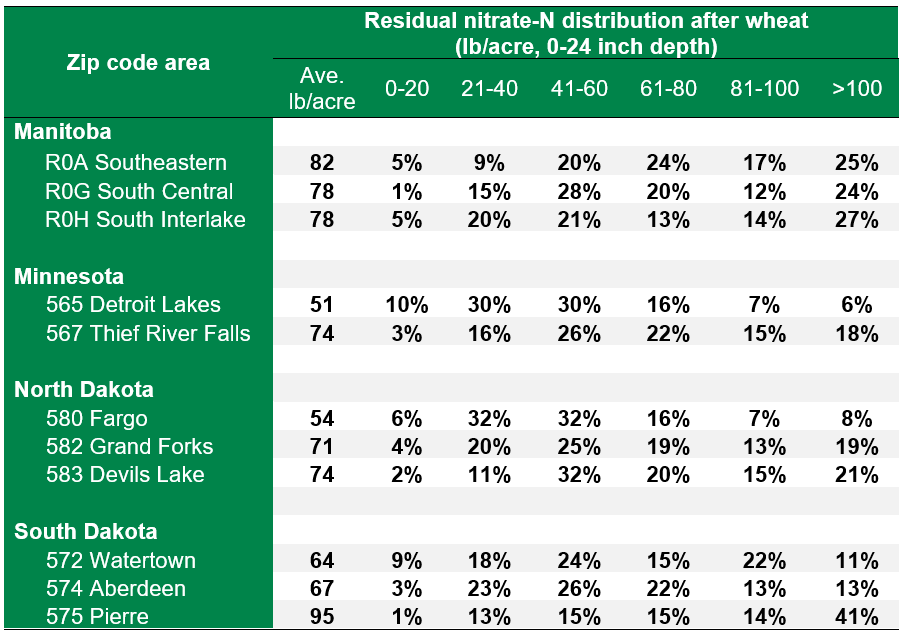
In Comparison, Here are our numbers for early season cereals.
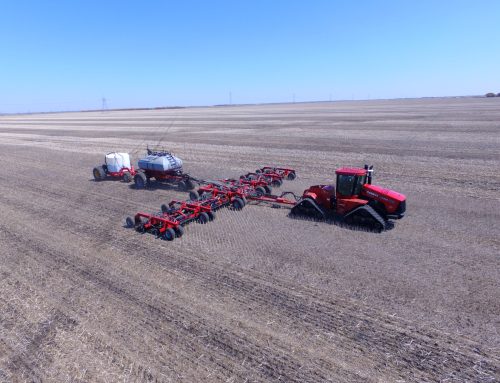
Soil testing this fall will help ensure that you’re not over or under applying nutrients. Levels will vary considerably between fields making a one size fits all approach less than ideal.
2. High N Residual Levels May Not Be Even Across The Field.
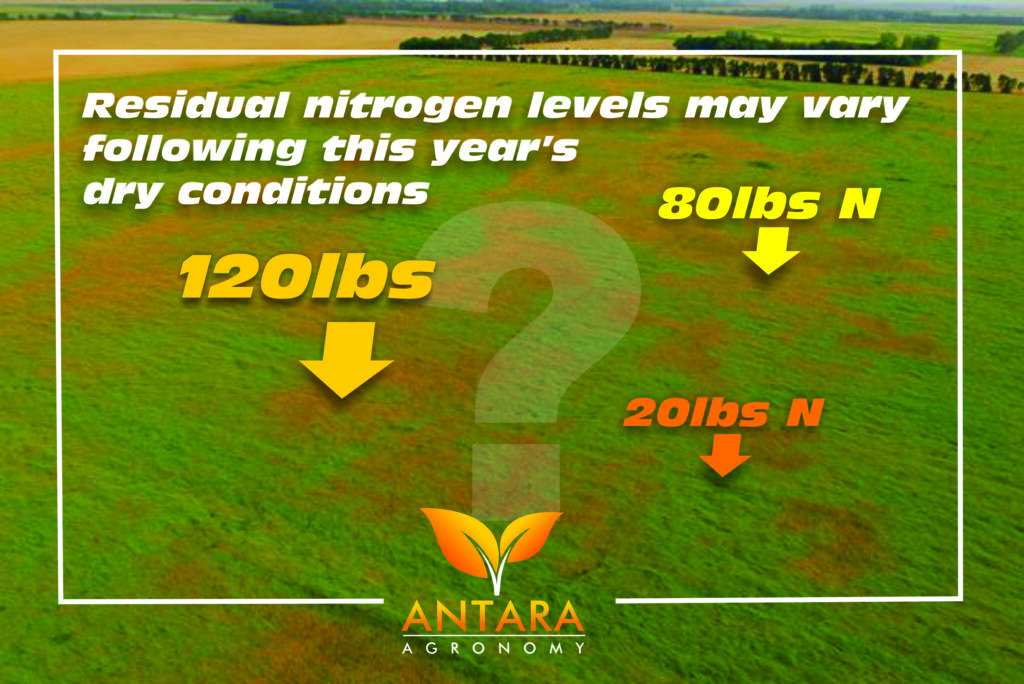
As shown in the graph below, the higher your soil test average, the greater the chance for variability. When moisture is a limiting factor in a field, it is also the major driver of yield. This is where soil texture and topography play a big role. Most of the nitrogen will be in areas that lacked moisture to convert it into yield.
Zone sampling may help get a better handle on residual N distribution within the field. SWAT Maps, which consider soil, water and topography characteristics, are well suited to capture this potential variability.
3. Soil Conditions At The Time Of Sampling Can Affect Your Results
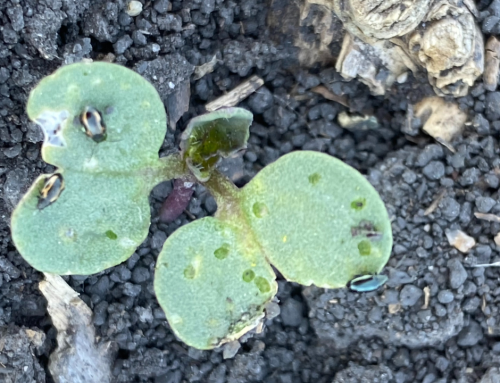
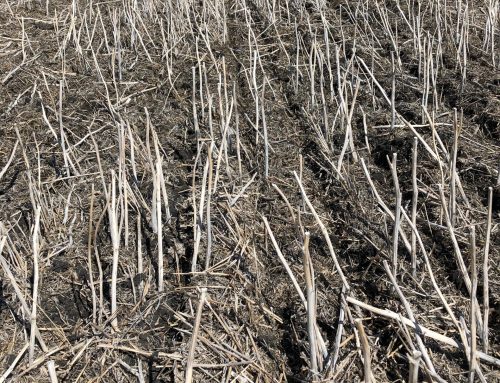
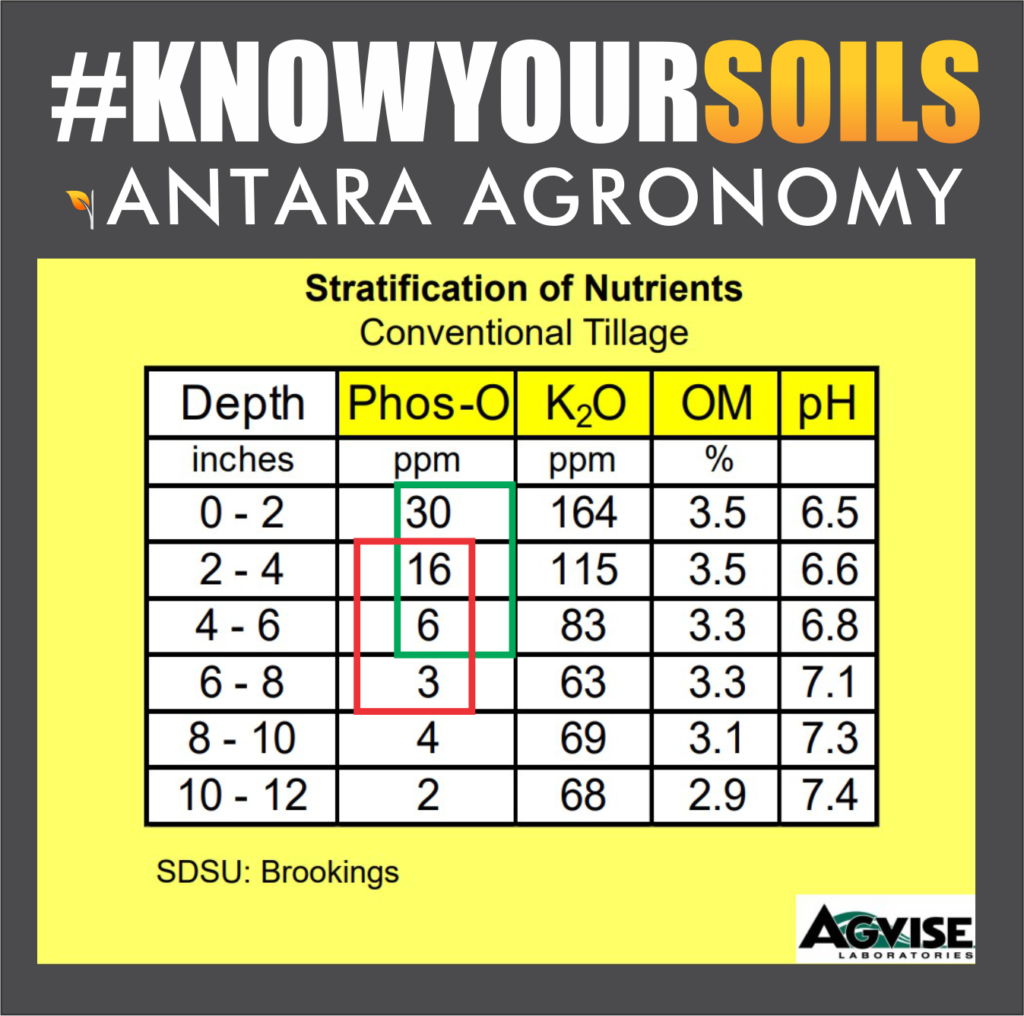
When the top inch or two of soil is dry and powdery it tends to trickle down the sampling tube and contaminate the rest of your sample. Many of the fertilizers we apply are in the top 3-4” of soil. If the top inch or two are not there, we might be sending the equivalent of a 1-7” or 2-8” sample to the lab. This could result in a diluted sample that might show lower in available phosphate and organic matter among other nutrients. It may also result in higher carbonate readings. The topsoil that trickles down the tube can also potentially inflate nitrogen levels in the subsoil sample.
The figure below shows how nutrients can be stratified in the top layers of soil and how a deeper core is not showing the right picture.
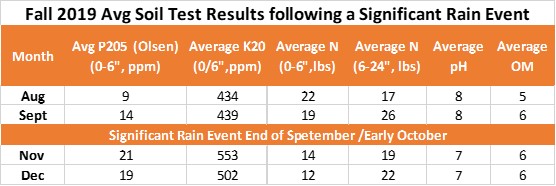
This next graph shows the difference in average nutrient levels both before and after significant rain events that limited sampling activities for much of October in 2019. We have to note that these are not the same fields and or crops sampled after the rains which may give us different residual levels.
Phosphate and potassium levels were higher after a significant rainfall and nitrogen levels were slightly lower which can be attributed to denitrification and/or leaching.
This is why we highly recommend that producers sample all their fields annually. By sampling annually, we can build a solid benchmark of all nutrient levels that we can use to spot erroneous data and make adjustments to our fertility plans. Many producers have yearly soil samples but how many keep a running record of how their results are tracking over time?
4. There Can Be A Quick Release Of Nutrients When A Significant Rain Event Follows Drought Conditions.
While better core samples can help explain some of the results, there can be other factors at play. Dr. Don Flaten, retired Soil Science Professor at the University of Manitoba, once shared that higher residual nitrogen numbers are sometimes seen in clay soils with high organic matter following significant rainfall events. The exact reason for this is not totally understood nor is it predictable, but it is believed to be caused by surviving microbes feeding on those that died due to dry conditions. It is also not well understood if the increase has long lasting effects or if levels back off once microbial populations re-establish themselves.
As explained above, yearly sampling will help establish benchmarks and allow you to spot erroneous data. If you have results that seem out of ordinary, check your sampling dates and ask your provider to see if they notice similar trends.
5. With the high prices of fertilizer and crops it has never been cheaper to soil test.
The cost of a soil test is negligible with today’s crop prices. It takes less than 2 lbs of N or P to pay for a basic composite test.
Fertilizer prices are at an all-time high. 30% higher than traditional levels. At $3-5/ac for a full fertility plan, you would need to save less than 10 lbs/ac in fertilizer or grow an extra ¼ bu of canola, ½ bu of wheat or 1 extra bu of corn to pay for it…..
A solid fertility plan will easily give one of the best ROI’s on your farm this growing season……
If you think good agronomy is expensive, you should see the cost of bad agronomy.
Don’t ask yourself if you can afford it! Ask yourself if you can afford not to?