Do you ever find yourself questioning soil test results that don’t seem quite right? Do you question the value of soil testing altogether because there never seems to be any consistency in results from year to year? Maybe you have been told that there is little variability in your soils because you are on a flood plain and the soil textures are too consistent?
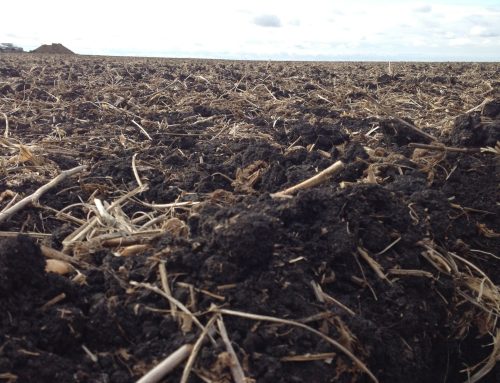
Over my 25+ years as a farmer and agronomist, I have always been puzzled as to why we see the variability in our soils. Red River Valley soils have been forming over 5000 years, since the retreat of glacial lake Agassiz. We have only been farming the Valley for a brief 100 years, but for the other 4900 years, water would pond in depression areas, slowly percolating and carrying organic matter deep into the profile. These depression areas often have a very well developed profile with dark soils extending 2-3ft deep and beyond. The ridge areas that shed water have a much shallower profile before hitting yellow clay parent material. The productivity of these areas has been further affected by problem erosion over the course of the 100+ years we have farmed it, further reducing topsoil depths.
I recently posted a video on soil variability in the Red River Valley that created a lot of interest. In the video I point out a common problem with our heavy clay soils that you may not know exists unless you’re frequently digging around in your soils – whether it’s digging soil pits, ditching, or pulling sample cores. I have always tried to correlate topsoil depth with topography, crop density, satellite imagery, and electrical conductivity, however I could not explain why some cores have 6″ of topsoil and others seemed to have as much as 24″ in areas that typically shed water (see paragraph above). It wasn’t until I noticed some soils had a honeycomb pattern below the surface after one of our clients had been doing some ditching (as seen in the video) that things started to click!
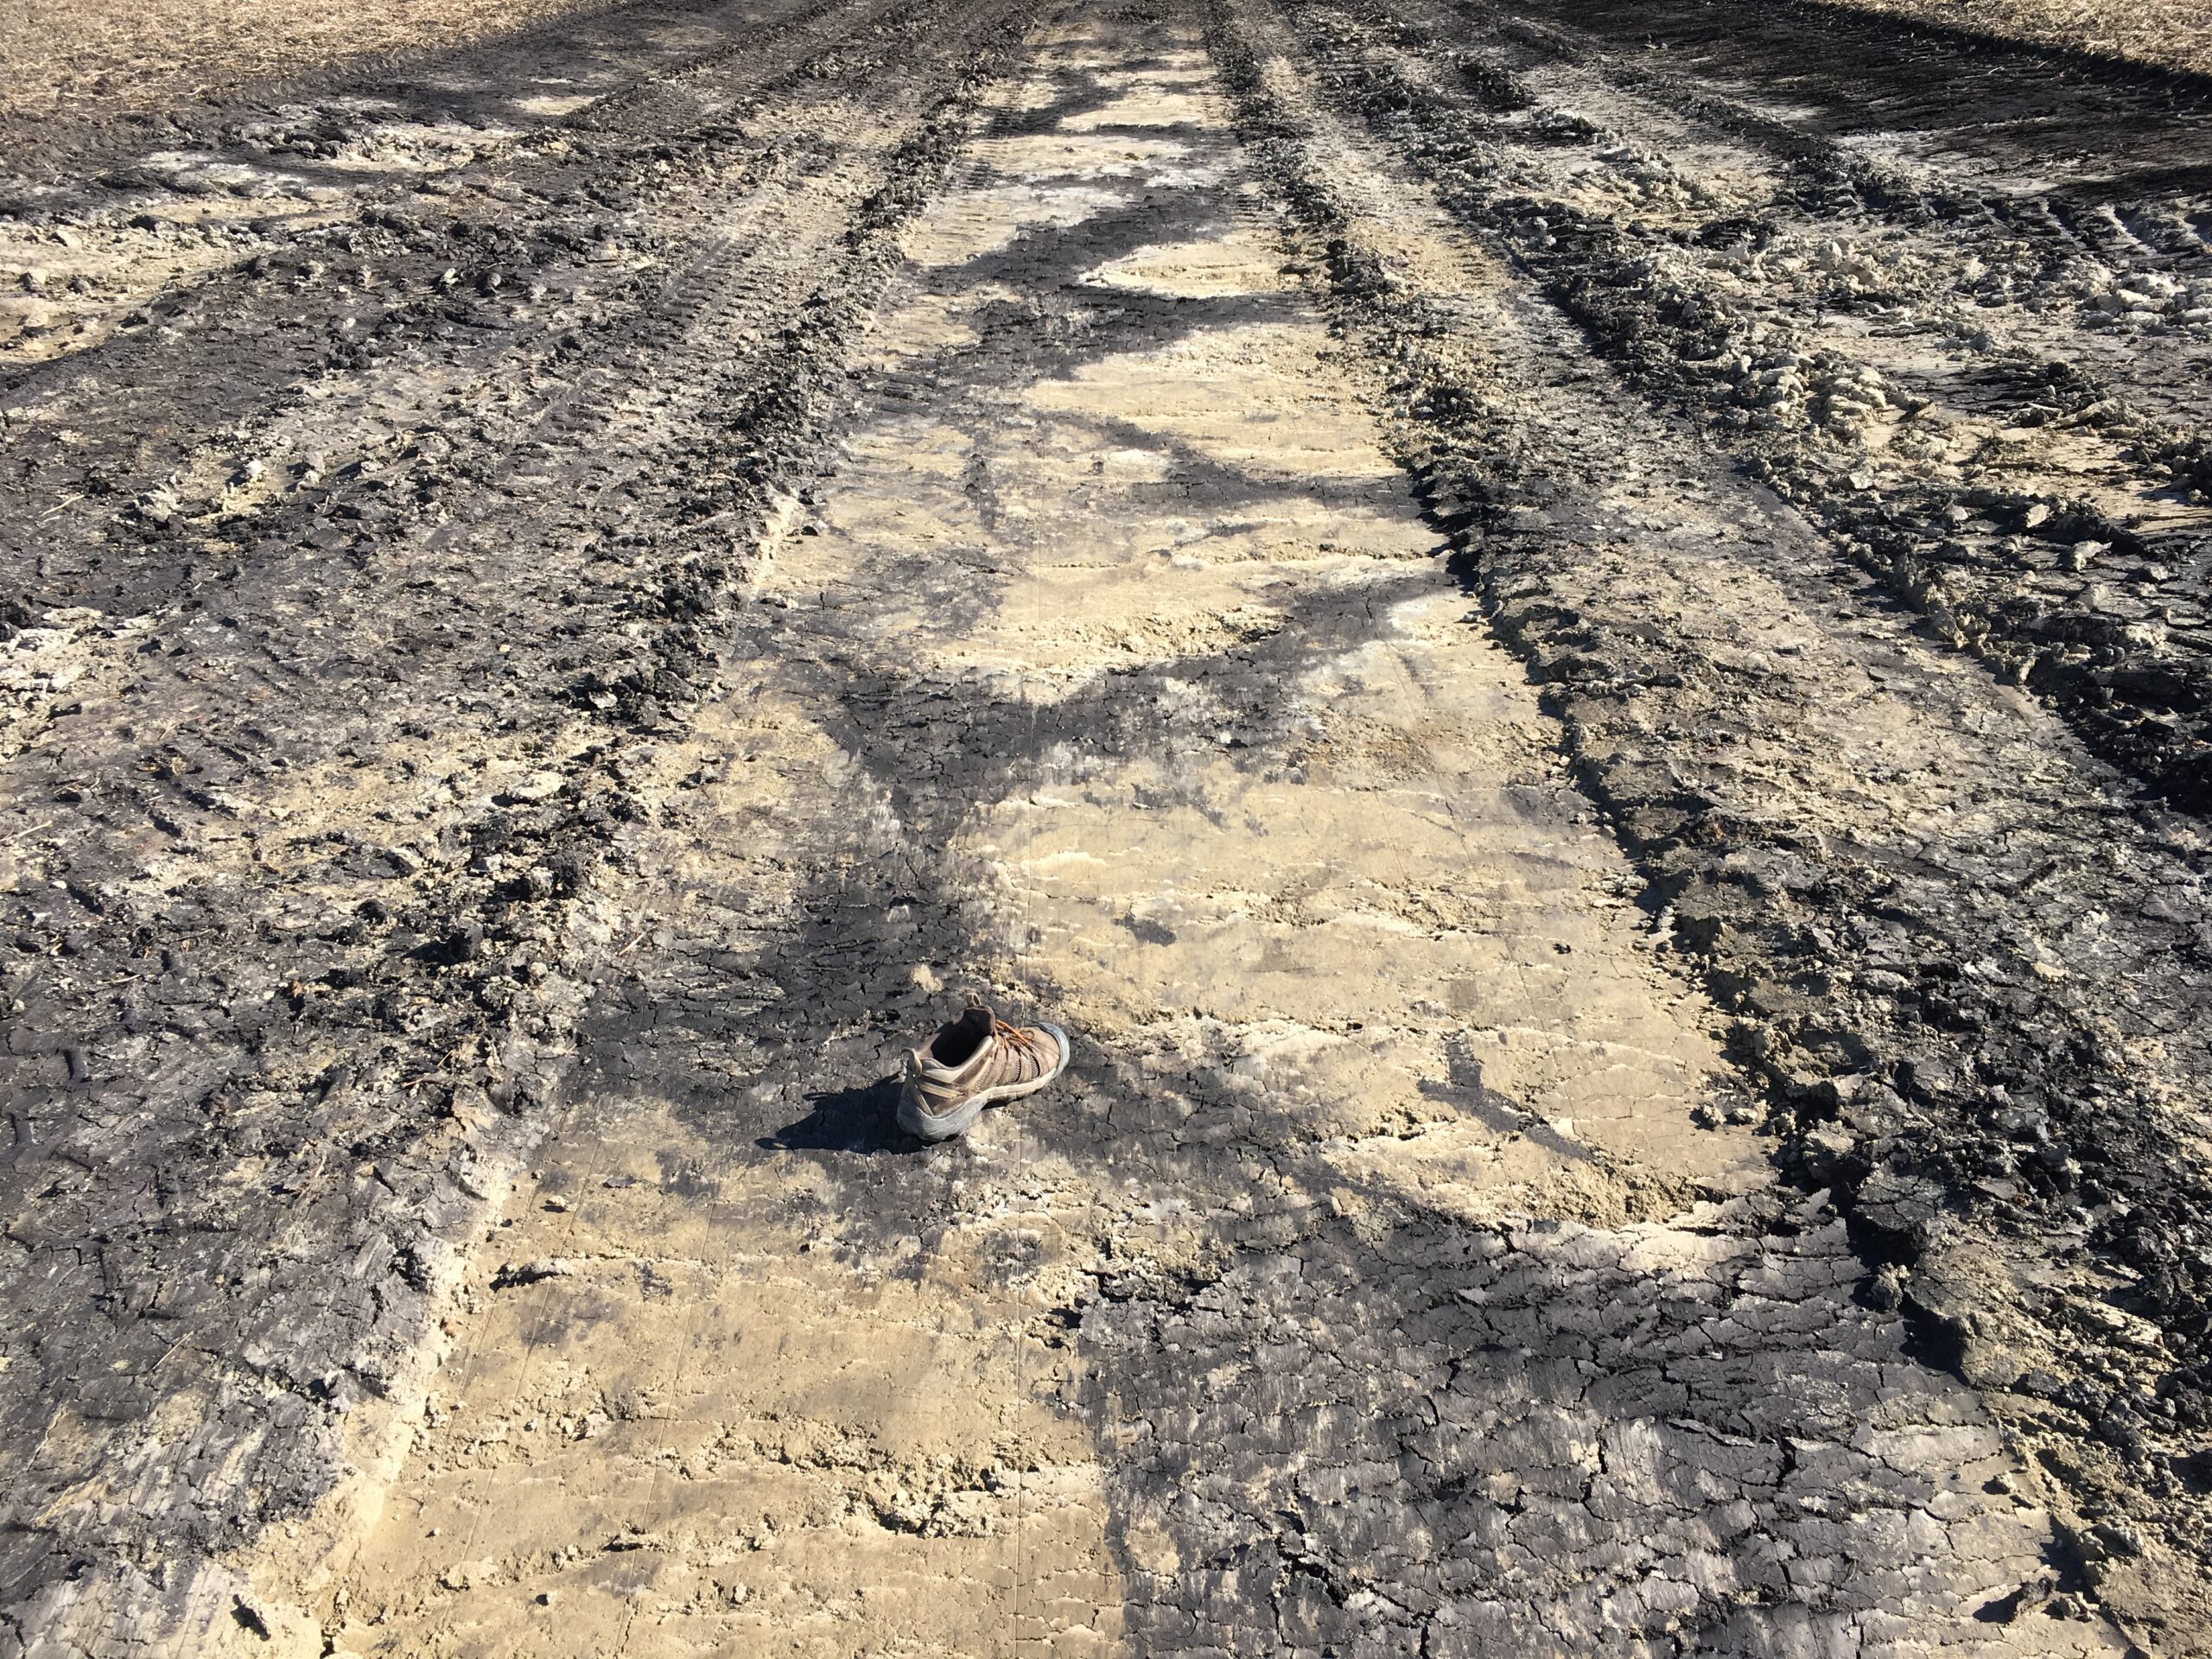
Observation led to the next logical step: dig some soil pits. This is when the puzzle became clearer. We found veins of topsoil measuring 1-2ft wide at the surface reached as deep as 3ft! The best explanation for this variability was due to the shrink/swell nature of our heavy clay soils. In dry conditions our soils shrink and massive cracks form. These cracks then fill with topsoil which is high in organic matter and holds more water. As soils freeze during the winter months, these areas expand and the process repeats itself. We’ve concluded that some of the sampling variability from year to year can be attributed to the presence of fertile topsoil that has moved into the soil profile via cracks.
The implications of soil test variability can be huge in terms of estimating available nutrients for an upcoming crop. Top soil is higher in organic matter which means higher available nutrients. Topsoil is also where we typically place all our fertilizer which also potentially inflates our estimates of available nutrients if we core into these areas and include them in our composite soil tests.
While the video clearly identifies a potential problem, I stopped short of offering any kind of a solution. Here are some of the strategies we can use to address the test result variability:
- Soil test annually. We recommend annual soil testing to all our clients. This allows us to develop base line averages that will help us recognize outliers, facilitate improved recommendations, and allows us to track general trendlines over time.
- Pay attention to core colour. Your soil test provider should pay attention to the topsoil depth in every core you pull and have the experience to recognize problem cores. Depending on where we are in the field, we expect different levels of developed profiles. A subsoil core’s colour should be different if pulled from a depression area versus a ridge that typically sheds water. If you pull a core from a ridge and it’s dark down to 24″, it might be better to pull a core from a different spot.
- Use professional mapping. Have your soils professionally mapped with a service that takes into account numerous layers such as water, topopgraphy and electrical conductivity. We are a dealer for SWAT maps from Croptimisitc Technologies because we find their zone map building process does the best job at uncovering these subtle differences in soil productivities. I should note that this process will not provide the resolution needed to deal with 2ft wide veins of topsoil, but they can help identify the areas in the field sharing similar characteristics.
- Consider new technologies. There are new technologies coming onto the market with the potential to help us uncover this field variability in a more cost effective manner which we will cover in-depth in a future post. Imagine being able to recognize and isolate a problem core in real time? New suites of sensors that give instantaneous results such as The Chrysalabs Probe (https://www.chrysalabs.com) or ATP’s Nutriscan Technology (https://atpag.com/analytics/nutriscan) will allow us to compare productive versus unproductive areas in the field. Because we can get near instant results every time we take a reading, we can quickly identify outliers. Matched with GPS locations, these data points can then be entered into GIS software to help make prescriptions for variable rate applications of crop input products.
A quality soil test is an important foundation to a solid fertility plan. Without this in hand, you may be overspending on inputs and/or leaving yield in the field. If you question the soil test results you have been receiving from your current provider, we can help! Antara Agronomy provides a premium agronomy service for growers in the Red River Valley of Manitoba. Give us a call and let’s grow together!